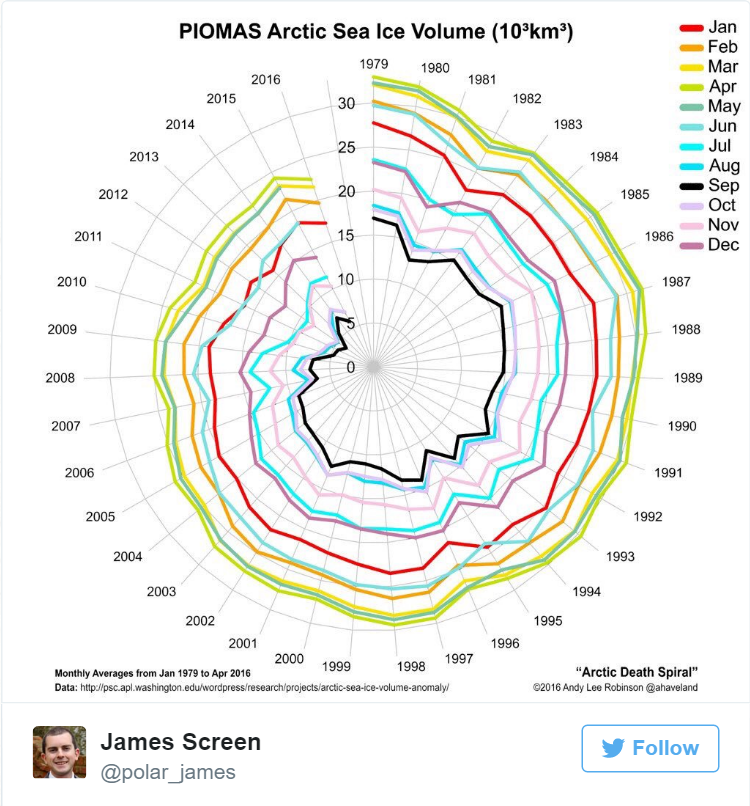
This new graphic representation of past temperatures up to the present, with expected increases to come ought to scare you, and with good reason.
The thing that I have tried to emphasize with increasing average temperatures is this: More energy into a system, where transfer is a constant, ongoing process, means that those processes that mitigate transfer have more input to work with, assuming of course that there remains significant differentials around the planet. As we've yet to get rid of all of the ice at the poles, coupled with the tilt of the planet's rotation (which gives us our seasonal variations), differentials will be with us for at least a good number of decades to come.
In any case, though, with more input to work with, transfer processes (convection, evaporation, condensation, radiation, and pressure change, etc.) become bigger in their expression, and more likely to occur over given periods of time. This is why we are talking about extreme weather now; where extreme can be a great deal more than just extremes of hot; as in wetter storms, storms with more powerful winds, or longer periods of no wind or no rain, as the flows of these transfer become more chaotic with the increases.
This is real because this is physics children, no matter what some idiot of a presidential candidate may tell you just to make you feel good, and encourage you to want to vote for him. People are dying from this, homes are being destroyed, and lives disrupted in horrible ways. Sticking your head up your ass to try and ignore it will not change what that, or how much worse it is going to get. One can only hope that you will start actually thinking for a change and act accordingly.

No comments:
Post a Comment